With Lab Me, understanding your blood test results using is easy with our intuitive dashboard design.
After you have purchased a test and your results are in. You will need to do the following:
You can click VIEW RESULTS at the top of the landing page www.labme.ai
Or you can save time right now by clicking here.
Next, you need to RESET your password for security measures.

Once you are logged in you will be at your main dashboard. Depending on how many tests you have done will determine how much data shows. Here is a dashboard with two years of quarterly testing.
The Main Dashboard

At this screen you are able to quickly see an over view of all your tests with color coded bars. Red being tests that were "at risk", yellow indicate borderline results, and green for optimal or normal range results.
Also, this screen shows you a break down of your current test. Which tests were at risk, borderline, & optimal. With the value and percentage change from the previous test.
If you only have one test - no percentage change will appear.
The Reporting Portion Of The Dashboard
Understanding your blood test results using visualized tracking.
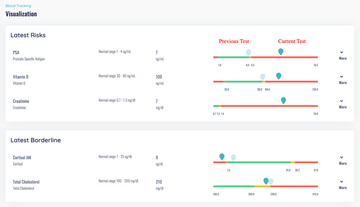
By clicking on "REPORT" on the left hand side menu - you will be able to see a detailed breakdown of each biomarker, graphical tracking, comparisons between your last two tests, information about that biomarker and specific information regarding your current test.

From here you can select "MORE" to the right hand side of the bar indicator. When you do so, you will be able to see the trend in that biomarker over time. This gives you powerful insight into how your body is responding.

Tracking your biomarkers over time is powerful. Just one test, randomly, doesn't tell you much. However, overtime (as you can see above) you start to notice trends telling you a much different story.
Noticing these trend early can be the difference between fixing a problem while it is small vs. a serious issue later in life. Understanding your blood test results with Lab Me allows you to do this affordably and from your own home.
When testing your blood regularly you will get to know your body like never before. You’ll understand what it needs, how your diet, lifestyle, training, supplements and medications are impacting your overall health and performance.
Build a personalized picture of how your body is responding to your diet, training, lifestyle adjustments and more.
With Lab Me Analytics
Collecting multiple scientific data points around your health means that you and your healthcare provider can make better decisions, faster and an individually tailored approach to your health. We believe that you should take control of your health and health data.
Get A Free Look At Our Dashboard
Want a guided walkthrough of the dashboard shown above? We won't call you or give you a demo - you can simply log in and have a browse around for yourself.
Understanding your blood test results has never been easier.


